Myriad spacecraft have orbited and continue to orbit the planet Mars, mapping its surface using a variety of different instruments and cameras. The most complete and detailed dataset has been acquired by the Mars Reconnaissance Orbiter‘s Context Camera (CTX). The raw images taken by the camera are skewed by the viewing angle and the changing perspective the camera has as it flies over the geologically diverse world, which includes both the highest mountain and the largest valley in the solar system. For scientists to use these images for research, they must be digitally transformed so that each pixel correctly maps to a given place on Mars’ surface, and these images need to be combined to create mosaics that can encompass features that span more than 1 (or more than 100) individual images.
Our research team has taken on the task of creating global mosaics of Mars representing different years (and seasons!) of observations. Done well, this data will allow never-before-possible research into Mars’ surface geology and even into how Mars is changing over time. Given current mission plans, this dataset is unlikely to be superseded for at least a decade.
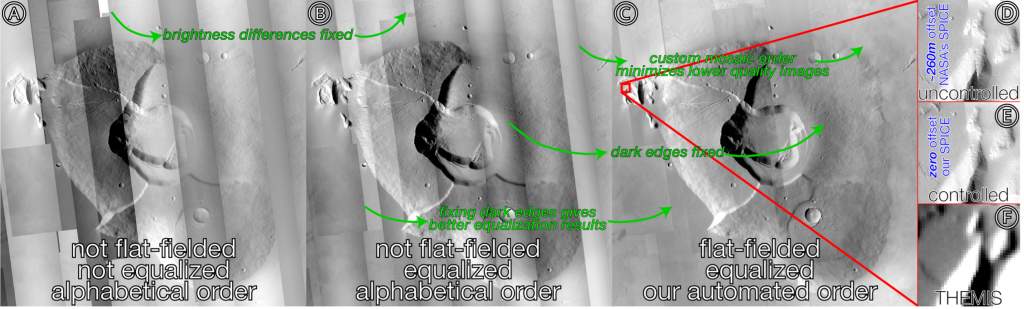
While software is capable of doing a lot of tasks on its own, it can’t check its own work, and it turns out that sometimes, computers just aren’t as good at combining images as we would like. This is where you come in.
We need your help comparing images created by our team’s software with images processed using traditional techniques. We need to make sure our images have pixel-perfect alignment. Where the software just didn’t quite meet this goal, we’ll need to go back and have it try again, this time using more points to match images and mosaic the data. Together, we can create a foundational data set like no other.
In the Mars Mosaic project, you will be shown regions of Mars and compare the uncontrolled images with the controlled results of our team’s software. Just looking at them side by side won’t allow you to see the differences (unless something went really wrong!), but by zooming in and comparing the images, either by adding them in different colors or subtracting the black and white images, we can make subtle changes stand out. You will have the chance to click between the overlaid images and difference images, and to even blink the two images back and forth, and then let us know how well the images align.